At the end of the monitoring year, the river sent the city two reports and neither one matched the other.
The first came from the instrument station: a continuous sensor on the bridge pier. Its graph showed clear water, low turbidity, and a gentle rise in conductivity after rain. The second came from a biologist named Ilya. He had counted mayfly larvae and stoneflies in the upstream shallows. Both were plentiful where the older map said the river should be clean. He had found almost none below the old textile mill. “Either the sensor is lying,” said Mayor Eno, “or the bugs are.”
The river’s monitoring team gathered in a station shed. A hydrologist named Sera spread out the records. A sensor could sample the water every fifteen minutes and show the shape of a change over time, but it measured only what its design could detect. A grab sample was a different kind of witness. Taken from one place and one moment, it could catch a pocket of polluted water, a pulse of sunlight, or a quiet stretch between events.
Neither instrument could speak for every hour of the year. Their black-and-white year graph was dense. The water rose after storms, warmed in July, and cooled in autumn. Flow mattered because concentration and load were not the same. A low concentration could accompany a large flow and carry a substantial amount of material past the bridge. A high concentration during low flow could represent less total material. The team had to ask what the water was doing, not only what the sensor printed.
The continuous turbidity sensor produced a clean curve. It bounced after rain, then settled quickly. An optical sensor inferred suspended particles from the way light scattered. The number was not a direct count of sediment. Rain stirred silt, but the model could also be fooled by bubbles, algae, changes in particle shape, or debris. A turbidity-derived sediment value was a modeled surrogate, useful for seeing trends, with uncertainty that had to travel with it.
It was not a scale weighing every grain. Ilya challenged the graph. “The mill released a pale discharge. The sensor barely noticed.”
Sera pulled the maintenance log. The optical unit had been recalibrated after a week of drifting readings. The old values had been adjusted with a model. Calibration made the instrument more trustworthy over time, but it also meant the final curve was not a raw untouched signal. The team had to keep the calibration history, check the sensor against a standard, and note when a value might be affected by maintenance or a sudden change in the river.
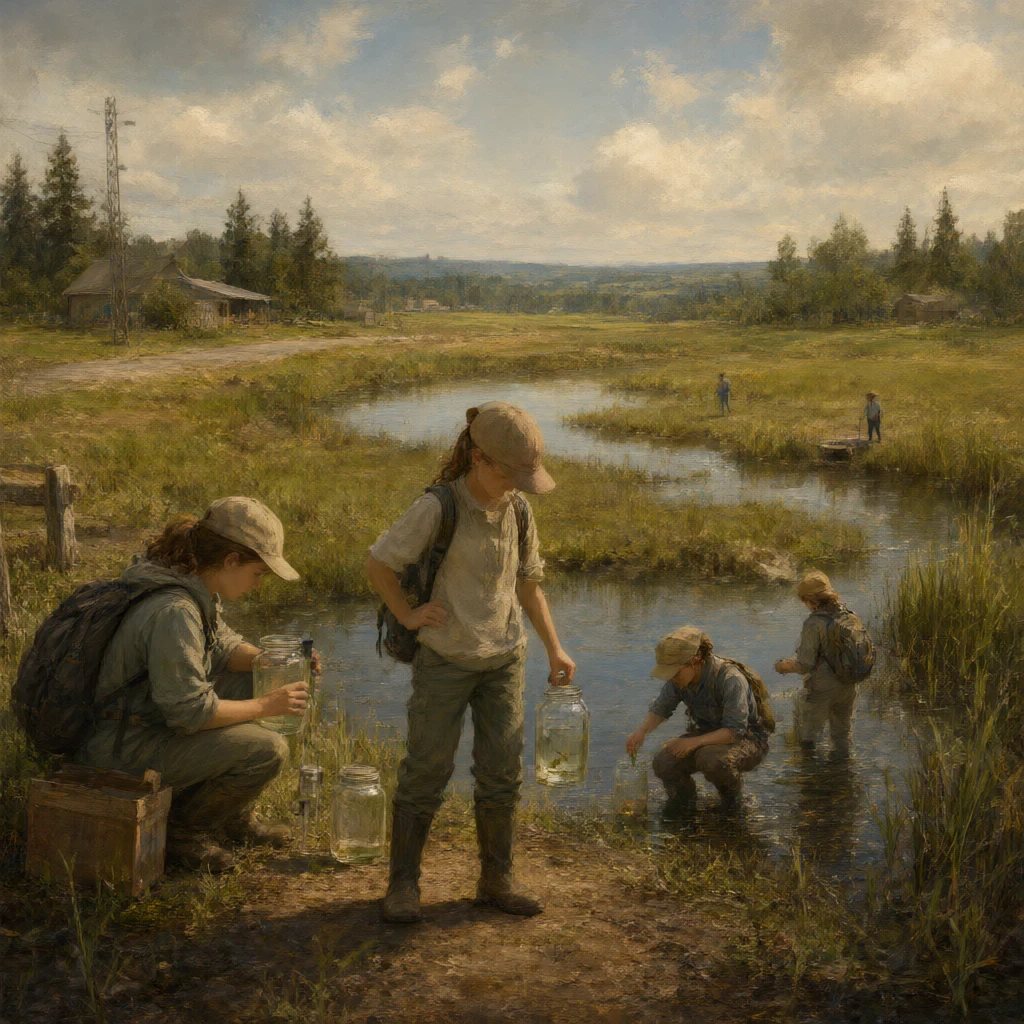
They visited the mill together. The outfall was quiet. The manager showed a permit and said the discharge had been replaced. On the bank, Ilya found the same mayfly gap. He waded into a side pool and lifted a stone. The underside was slick with a pale film. A lab bottle of water from that pool turned cloudy after a test. It was a snapshot, not a year.
It agreed with the biologist’s observation, but it did not identify the source by itself. Sera took duplicate samples: one from the main channel and one from the side pool. She measured temperature, pH, dissolved oxygen, conductivity, and nutrients. The main channel looked ordinary. The side pool had a different pH and lower dissolved oxygen. The difference showed that the river was not one mixture. It had pockets, flow paths, and times.
The team added a biological survey to the same route. Ilya and his assistants used kick nets to sample riffles, where stones were shallow enough to disturb. They recorded the diversity of organisms and identified taxa that were sensitive to changes in water quality. A sensitive taxon missing from one reach could be a warning, but it could also reflect flow, substrate, temperature, or the time of day. Biological evidence carried its own limits.
It answered not only what was dissolved but what conditions allowed life to persist.
The station’s dissolved-oxygen sensor and the bugs pointed in the same direction below the mill. The conductivity sensor did not. Eno wanted to declare the case solved. Sera asked where the mill’s pale discharge had gone during the storm. The data showed a short pulse of turbidity, but the sediment estimate rose and fell faster than the known flow. The model had not been tested for that range. The pulse was a useful lead, not a calibrated quantity.
They returned in a week of clear weather. The main channel remained ordinary. Ilya found young stoneflies above the mill and none below it. A sampling crew reached the side pool only after walking through a private yard. The absence of a familiar insect was repeated evidence, but the team needed to know whether the survey gear, the current, or the time of day could explain it. They sampled several reaches with the same effort. The pattern persisted in comparable places.
A local fisherman produced a notebook. It was not a scientific instrument, but it recorded when nets were used, what was caught, and the weather. The pages showed that pollution complaints had appeared during the same months as mill repairs. They did not prove the mill was the only cause. The fisherman had not tested a control and had chosen which events to write down. Still, his observations could be compared with the records rather than accepted as a conclusion.
The team’s challenge was to build a panel of evidence, not a choir that repeated the same voice. Continuous sensors provided the shape of change. Grab samples provided details at chosen times. Flow records supplied context. Calibration connected the instrument’s response to known checks. Biological observations revealed conditions that chemistry alone might miss. Each witness had strengths, and each could fail in a particular way.
Sera built an interim map with symbols for confidence. Solid lines marked repeated, calibrated observations. Dashed lines marked uncertain connections. A side-pool finding was linked to the mill only as a hypothesis. The biological gap was stronger because it repeated across comparable reaches, but it still required caution. The turbidity estimate carried a range rather than a single sediment total.
The interim report said the evidence supported a recurring impact below the mill, not that every sediment grain had been accounted for. Before the next round of tests, Ilya placed a stonefly in a small observation jar with river water. It moved briefly, then rested against the glass. Eno watched it. “A living thing is not a number.” “No,” Ilya said, “but it is evidence. The number and the bug should make us suspicious when they disagree.”
The city repaired the outfall and changed a section of the bank. In the next month, the side pool’s chemistry improved, and sensitive organisms returned in one reach. The continuous sensor showed less turbidity during the rain pulse, but the flow still carried sediment from upstream. The river was not magically restored by one good result. The team continued its panel, because restoration needed another season, another storm, and another disagreement checked rather than hidden.
The team did not discard the first sensor simply because it disagreed with the side pool. They tested the whole chain. They checked the clock against noon, compared the sensor’s response with a known cloudy standard, and inspected the cable where fishers had repaired the bank. A calibration record showed a small drift, but not enough to explain the entire pattern. The continuous instrument was still valuable for timing. It could show when the river changed, even when it could not identify what changed.
The biological survey had its own controls. Ilya sampled the same depth of riffle, used the same net effort, and recorded the weather. A reach where the substrate was muddy had fewer organisms, even though its chemistry looked acceptable. The absence of sensitive taxa in a different kind of habitat could be explained by the habitat itself. By comparing reaches with similar stones, speed, and depth, the team found the biological gap repeated where the outflow entered. The panel grew stronger, but the controls kept the result from becoming a sweeping claim about the entire river.
The engineers added a grab sample after the first storm of the next season. The bottle was cloudy, but the lab measured the particles and checked the model against a weighed filter. The sediment estimate shifted within a range that the model could support. Flow was higher than during the sunny sample, so the total amount transported was not the same as the concentration. The team wrote both values.
A river can be clearer at noon and carry more material during a storm; a single pleasant-looking sample cannot represent the year.
The yearbook mystery lasted another season before the team declared a finding. During a warm, low-flow week, the turbidity sensor stayed nearly flat, yet Ilya’s nets found no sensitive taxa below the old mill. The lab bottle taken from the main channel was clear, and a second bottle from the bank looked almost identical. Only the third bottle, taken where the pale water entered a shallow side channel, showed low dissolved oxygen and a film on the stone.
The disagreement was not between a good sensor and a bad bug. It was between samples that represented different routes through the river.
Sera asked the engineers to install a small sensor in the side channel for a month. Its readings were noisier, but the team calibrated it beside the main station and recorded every time the probe was moved. The new trace showed short pulses that the bridge sensor missed because the branch rarely carried enough water to raise the main sensor. Ilya’s biological samples were scheduled after those pulses, but he also sampled quiet days.
Sensitive organisms disappeared during the pulses and returned slowly afterward. That pattern linked the living evidence to the flow context without claiming that turbidity alone measured the cause.
The team then challenged its own calendar. The bridge log had been written by a different observer during a week of instrument work. One continuous record had been copied from a field notebook whose time zone differed by an hour. Sera corrected the alignment and kept the uncorrected series beside it. The corrected chart still showed the mill-related pulses, but their exact timing changed. Calibration and custody were not footnotes to the result.
They were part of what the result was allowed to say.
At the public meeting, Eno admitted that the first instinct had been to trust whichever witness was easiest to read. The team’s final map paired the continuous curve, the flow record, the calibrated grab samples, the modeled sediment range, and the biological survey. Each source had a different blind spot. Their agreement across independent routes made the recurring impact more credible, while the quiet stretches and missing observations kept the conclusion from becoming a perfect story.
On the last page of the yearbook, Sera drew two witnesses: one machine and one mayfly. Beneath them she wrote a third thing, a calibration check. The river had spoken in several voices. The team’s task was not to choose the most dramatic voice, but to learn which voices could answer which questions.