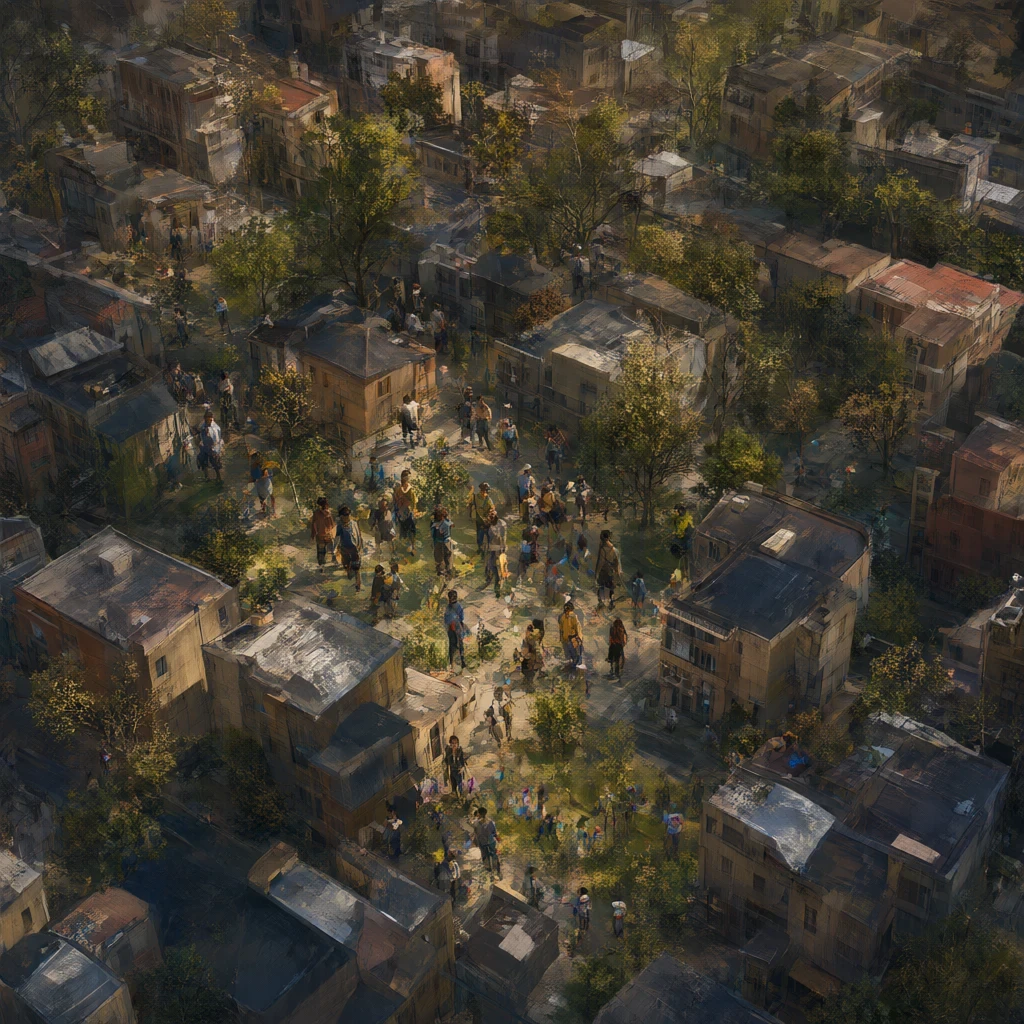
The first thing Mara noticed was that the city did not cool when the sun went down.
She lived above a bakery in the oldest district, where stone walls held the afternoon heat. Across the river, the new gardens cooled quickly after sunset. Her grandmother said the city had a fever. Mara’s teacher, who measured weather for the school, gave the phrase a less useful meaning: a city could become warmer than the countryside around it, especially when streets and roofs absorbed sunlight during the day and released it later.
“You cannot see heat merely by looking at a roof,” the teacher said. “Measure it. Then measure it again when the weather changes.”
Mara joined a small neighborhood team with a thermistor, a weather screen, maps, and permission to borrow balconies. Their assignment was to compare three places: a broad paved square near the station, a row of houses with few trees, and a neighborhood beside the river with gardens and shade. They would visit each place in the afternoon, at sunset, and late at night. They would record air temperature, surface temperature, wind, cloud cover, and the time.
Their first map looked simple enough to print. The station square glowed on the paper. The gardens stayed cool. A red line connected the hot places, and the team almost declared the cause before checking their work. The teacher stopped them. “Warm pavement is a clue,” she said. “It is not the whole explanation. Soil, walls, shade, traffic, wind, and the time of day can change the result.”
Mara placed the sensor on the square’s dark stone. Its reading rose quickly. She placed the same sensor on a sunlit metal lid. The metal was much hotter than the air. When she lifted the sensor into the shade, the number fell. The two measurements were both correct, but they answered different questions. The metal’s surface was storing and releasing energy. The air around it was a separate quantity, warmed by the surface and by the air itself.
The team began to suspect that the city’s streets acted like enormous shallow trays. Impervious surfaces—pavement, concrete, brick, and roofing—absorb solar energy during daylight and release it after sunset. Vegetation cools in another way: leaves evaporate water, using energy as the water changes from liquid to vapor. When water is available, that process can cool a leaf and the air around it. In dry weather, or when roots cannot draw enough water, the cooling can weaken.
That did not mean every paved place was hot in every measurement. Mara’s team learned to ask for a range rather than a number. On a breezy afternoon, the square was only a little warmer than the gardens. On a clear, still evening, the difference grew. The team repeated the route during both kinds of weather. They were not trying to choose one “best” day. They wanted to see when the city’s heat became most difficult to escape.
At sunset, a child in the station district poured a pail of water onto the pavement. The dark stone darkened, and the air above it felt briefly cooler. Mara believed they had found a solution until the teacher asked what would happen if the water had been scarce. The team measured evaporation by weighing a shallow tray of water and comparing it with a tray left in a sheltered spot. The readings changed with humidity, wind, and sunlight.
A single splash was visible. A dependable cooling plan would need a sustained supply of water and a surface designed to let water leave.
The city council offered three tests. One neighborhood would receive pale roofs, another would receive rows of trees and planted courtyards, and a third would receive a combination. Mara’s team was not allowed to choose only the most attractive places. The council wanted to know whether the interventions made a measurable difference under different conditions, so they selected matched blocks and left nearby blocks as comparisons. The team marked every sensor location and recorded who had access to which site.
The trees took time to grow. For the first season, the young trees cast little shade. The gardeners watered them, but one heat wave came after a dry month. A soil probe showed that the root beds held less water than expected. Some leaves wilted. The intervention was real, yet its result depended on the care and the weather. A street with more trees was not automatically a cooler street.
The pale roofs behaved differently. Their upper surfaces reflected more sunlight and became cooler than the dark roofs beside them. Indoors, however, the readings were mixed. Some rooms cooled. Others stayed warm because heat entered through windows and walls, and because the building’s occupants used appliances and lights. The roof surface told one story. The indoor air told another. The team reported both instead of choosing the number that made the project look successful.
On a windy night, Mara carried the sensor along the river. The wind had risen, and the gardens and square became much closer in temperature. The city still glowed from stored heat, but moving air carried some of it away. The next night was clear and nearly still. The station square remained warm after midnight, while the river neighborhood cooled more quickly. The contrast was not an enchantment sealed into a district.
It was the result of surfaces, shade, water, urban form, waste heat, and the air’s movement, all changing together.
The team began measuring waste heat too. Traffic warmed exhaust and asphalt. Factories and power stations released heat into the streets and air. Buildings consumed electricity, which often became heat at some stage. The amount varied by hour and season. A warm exhaust pipe was evidence of energy leaving a machine, but the amount reaching a pedestrian was not easy to calculate. The team used rough notes rather than pretending to measure every building. They marked the limitation beside the estimate.
Mara’s old teacher called the city’s heat an urban heat island. The name did not mean the entire city was one hot patch. The effect could be local, stronger in some neighborhoods, and different on a windy day than on a calm one. A city’s shape mattered too. Tall buildings could shade a street while trapping long-wave heat among them. Narrow courtyards might have little sky. A broad park could let air move through. The same weather could therefore produce different surface and air temperatures a short distance apart.
The team met a baker who had iced his roof with a borrowed white wash. He expected the whole street to cool. The sensor showed the roof cooler, the doorway slightly cooler, and the room almost unchanged. Mara realized that an intervention could be genuine without solving every path for heat. Heat could enter through many routes: sunlight, warm air, walls, windows, appliances, and people. A good plan needed a map of those routes, not a single impressive photograph.
Weeks passed. The combined block gained shade as the trees grew and the roof paint stayed bright. On humid days, the effect was smaller. On clear nights, the planted courtyards held water in the soil and released less heat than the old pavement. The school garden, however, was still a clear success because it had both vegetation and a working watering plan. The team marked each contribution separately so a later change would not be blamed on the whole project.
The council wanted a single announcement. Mara wrote a more careful one instead. The city’s built surfaces stored and released heat; reduced vegetation and evaporation added warmth; urban form changed how much sun and shade reached people; and human energy use added another source. The strongest contrasts often appeared after sunset. Air and surface temperatures were related but not interchangeable. Wind and clouds could change the pattern. The proposed changes helped under the measured conditions, and their limits were recorded.
The measurements changed the team’s ideas about the first intervention. A pale roof was not simply a bright roof. It received less solar energy at its surface, but the neighborhood still received energy from walls and streets. Mara placed one thermometer in sun and one in shade, then compared them with a small infrared surface thermometer. The sunlit patch was hot enough to make a child’s shadow striking. In shade, the same child was comfortable. Air temperature described the surrounding air; surface temperature described what a hand or roof would encounter. The map needed both colors.
The team also learned that a windy comparison could hide a real effect by helping every neighborhood. On the windy night, moving air mixed the layers near the ground. The square cooled faster than usual, though its stones still held warmth. On the clear night, the lack of wind let the warm air remain close to the pavement. A cloud deck could make another difference by limiting solar heating before sunset.
The team did not label the windy day “good” and the clear day “bad.” They labeled the conditions and asked what the city would experience under each.
The council tested a bus route that moved vehicles away from the school entrance during arrival. Traffic had warmed the pavement and sent exhaust into a crowd of children. The reroute reduced the heat at the curb on two afternoons, but a delivery schedule brought the same trucks back at closing time. The result improved one place while shifting another. Urban form and waste heat were not problems confined to a single block.
They moved along streets and accumulated where people waited. A plan had to follow the movement instead of celebrating a small local victory.
Before the final walk, Mara arranged a paired test at the station square. The team placed the same air sensor in a shaded arcade and on the exposed paving, then repeated the pair at the riverside garden. The exposed sensor rose fastest during the afternoon, but the difference narrowed after sunset. A second observer carried the instruments along the reverse route so a fast walk could not create a false pattern.
The numbers showed where the team’s route had crossed a bus exhaust plume, and the plume became a new reason to record traffic during future nights.
The council then asked whether the new trees should be planted on every block. Mara proposed a dry-season test instead of a citywide promise. They would compare equal areas with young trees, mature shade, and bare pavement, then measure soil moisture before and after a hot afternoon. The young trees did little until the gardeners added mulch and water. The mature shade cooled the air beneath it, but its roots reached a buried water line.
The test exposed costs and care that a simple “more trees” slogan would hide. The council funded a maintenance budget and published the next reading schedule.
On the last night, the team walked the route once more. A child stood beneath the new tree, holding a cool cup. The station square was still warm to the touch, though the air had begun to settle. Mara looked at the thermistor and the map together. The city had a fever, but fever was not a sentence. It was a set of conditions that could be measured, compared, and changed by people willing to learn from the next measurement.